


Study on Evaluation Method for PVA Fiber Distribution in Engineered Cementitious Composite
Shin-ichi Torigoe, Tetsuo Horikoshi1, Atsuhisa Ogawa, Tadashi Saito2 and Toshihiro Hamada2
1 Abstract
The distribution of fibers in Engineered Cementitious Composite (ECC) is one of the most important factors in terms of the mechanical performance of the composite. However, estimation of fiber distribution in ECC has been a difficult problem because of the lower contrast of organic fiber in the cement material. To overcome this problem, we demonstrated a new evaluation method for the distribution of discontinuous Polyvinylalcohol (PVA) fibers in ECC. By using a fluorescence technique on the ECC, we were able to observe PVA fibers as green to yellow dots in the cross section of the composite. After capturing the fluorescence image with a CCD camera through a microscope, the image was divided into small units of the appropriate pixel size. Then, the degree of distribution was calculated with the deviation from the average number of fibers in one unit. By adjusting the preferable unit size, we found a relationship between the degree of distribution and the ultimate tensile strain of the composite.
2 Introduction
High strength organic fiber is one of the key components of Engineered cementitious composites (ECC) (Lim and Li 1997). Polyvinylalcohol (PVA) fiber is a promising candidate for this purpose. In the case of ECC, the content of the fiber is ca. 2% volume, which is somewhat high compared to conventional FRC. Since the fiber bridges between microcracks, the distribution of fibers in the composite strongly influences the mechanical performance of the composite. When we apply these composites to practical use, a quantitative evaluation method for the distribution of fibers in the composite is indispensable technology. Regarding organic fibers, however, we do not actually have such a method. For example, transmission X-ray photography used for steel fiber reinforced cement does not work for organic fiber.
What makes it difficult to distinguish organic fiber in ECC using the X-ray method and the optical microscopic method is its low contrast with cementitious materials. This problem was overcome by using a fluorescence technique in the case of PVA fiber. It is known that many materials show fluorescence when irradiated with light. Since the fluorescence technique has a very high level of sensitivity because of the low background signal, it is widely used especially in biomedical fields, for example, Green Fluorescent Protein (GFP) in molecular biology (Chalfie et al. 1994). We tried to apply this technique in detecting PVA fibers in a cementitious composite. ECC showed no fluorescence except for PVA fibers, and we found that PVA fibers appeared as green to yellow dots in a cross section of composite through a GFP filter. The captured images were analyzed with image analysis software and a statistical index. To evaluate the image quantitatively, the image was divided into small units having an appropriate pixel size. By adjusting the preferable unit size, we found a relationship between the degree of distribution and the ultimate tensile strain of the composite.
This paper reports our experimental study on an evaluation method for PVA fiber distribution in ECC using the above method.
3 Experimental procedure
3.1 Specimen preparation and tensile test
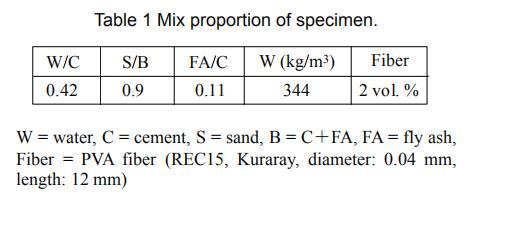
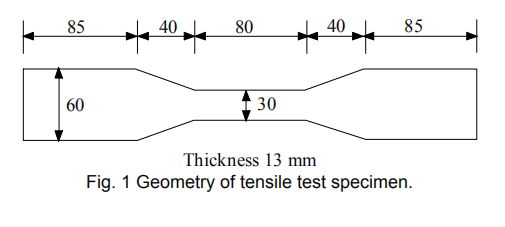
Specimens for the direct tensile test were prepared as follows. Normal Portland cement supplied by Taiheiyo Cement Co., Ltd, sand, and fly ash II supplied by Kanden Kakou Co., Ltd, water and fiber were mixed in the mix proportions listed in Table 1 using a Hobart mixer, and were cast into a dumbbell mold. Then, the specimens were de-molded and cured under water for four weeks. The geometry of a specimen is shown in Fig. 1. The middle part of the specimen has a thickness of 13 mm, a width of 30 mm and a length of 80 mm
Tensile tests were conducted at a speed of 0.2 mm/min using the Shimadzu Autograph AG-5000B.
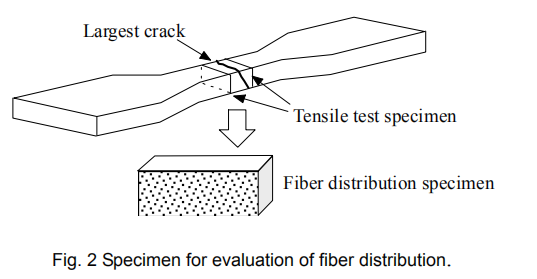
After the tensile test, the specimens were cut close to the largest crack with a diamond cutter to obtain the cross sections. This is because the weakest structure is located around the largest crack. As shown in Fig. 2, one piece of each specimen with a height of 13 mm and a width of 30 mm was utilized as specimens for the evaluation of fiber distribution .
3.2 Evaluation of fiber distribution
To evaluate the fiber distribution in the above specimen, it is necessary to obtain the position of each of the fibers in the cross section. As mentioned in the previous section, we applied the fluorescence technique to the problem.
Without polishing, the cross section of the specimen was observed through a fluorescence microscope (Leica, MZ FL III). Using mercury lamp illumination, a fluorescence image was captured with a CCD digital camera (Nikon, Coolpix 9903) through a GFP filter under 8× magnification, as shown in Fig. 3. The whole cross sectional image (1800 x 760 pixels) of one specimen was constructed by connecting two images (1280 x 960) with image processing software (Adobe Photoshop 5.0J).
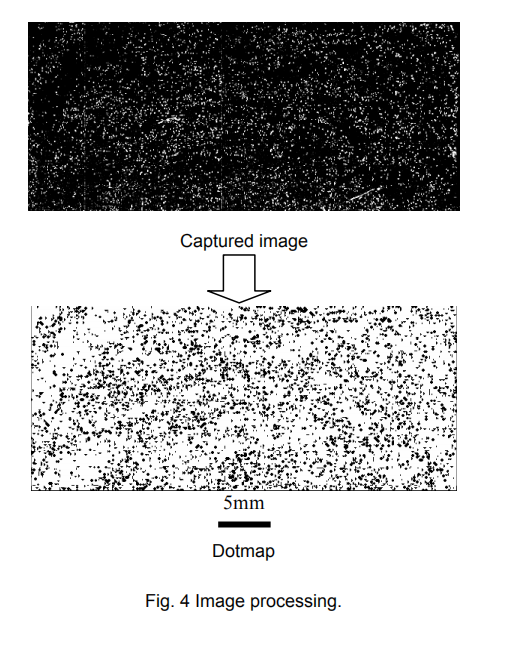
The cross sectional image was analyzed with image-analysis software (Media Cybernetics, Image–Pro Plus) to obtain the relative positions of each fiber in the cross section. At first, the captured image was converted to a binary image. Since each white particle of that image shows each fiber, the coordinate of the cen Fig. 2 Specimen for evaluation of fiber distribution. ter of the particle represents the fiber position. Then, the position of each particle was collected. Figure 4 shows a sample fluorescence image (upper) and fiber-positions reconstructed by particle coordinate (lower). The number of fibers in the cross section was around 4000.
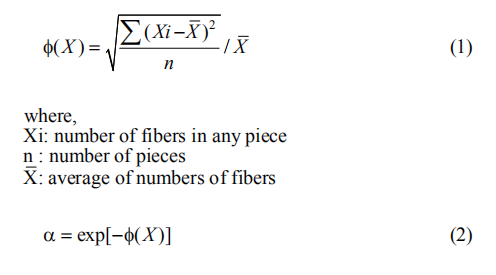
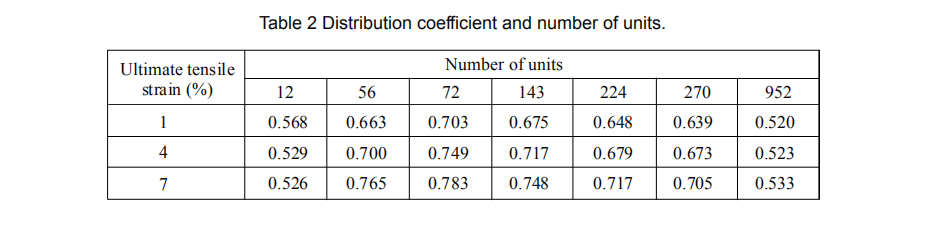
The numerical evaluation of fiber distribution was calculated using the deviation of the number of fibers from the average number of fibers in a unit area. Since the size of the area influences this evaluation, we checked it first. The whole cross sectional image of the specimen was divided into 12 (a unit size of 450x253 pixels), 56 (225x108), 72 (150x126), 143 (138x69), 224 (112x54), 270 (100x50) or 952 (52x27) pieces. The number of fibers in each piece was counted and the coefficient of variation φ (x) was calculated (Eq. 1). The distribution coefficient α was calculated as an exponent of -φ (x) (Eq. 2) (Kobayashi 1981). A distribution coefficient of 1 means that the number of fibers in each piece is the same, i.e. fiber dispersion is homogeneous. The tensile test specimens that showed an ultimate tensile strain of 1%, 4% or 7% were analyzed to find the preferable unit size. In this analysis, only one section for each sample was used. After that, other specimens were analyzed in the same way.
4 Results and discussion
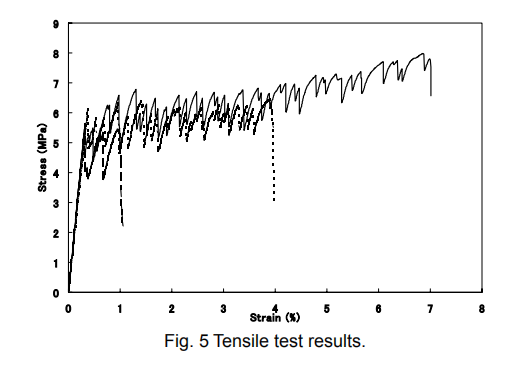
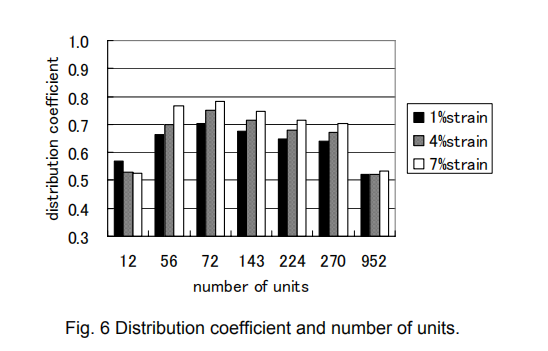
Typical tensile test results are shown in Fig. 5. Despite the same preparation, there were wide variations in tensile test results. The results of the distribution coefficient for each number of units are shown in Table 2 and Fig. 6. We can see the difference in the distribution coefficient between the specimens with a number of units between 56 and 270. Despite the 5 times difference in the number of units, the distribution coefficient trends between the specimens were identical. Therefore, the preferable number of units is between 56 and 270. All other conditions being equal, the 56-division unit is the most sensitive. However, we applied the division unit in the following analysis. In reality, there were edges or boundaries in the cross sectional image and such defects produced large deviations in the number of fibers. In the case of a smaller number of units, such deviation would seriously affect the distribution coefficient. Therefore, a larger number of units is preferable.
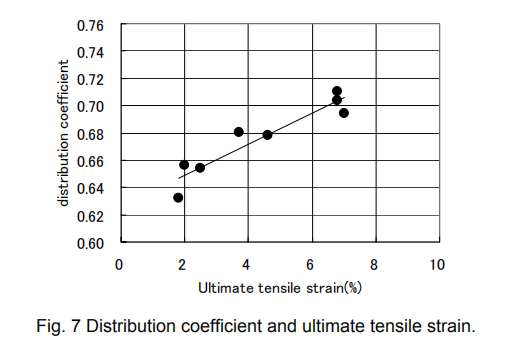
We analyzed the rest of the specimens using division into 270 units. The ultimate tensile strain and distribution coefficient for all the specimens are plotted in Fig. 7. We can see a correlation between the distribution coefficient and the ultimate tensile strain. This relationship indicates that the differences in ultimate tensile strains among these specimens will be ascribed to the difference in fiber distribution. This result suggests that the mechanical properties of ECC are strongly influenced by the fiber dispersion. Uniform dispersion leads to more a ductile composite. The dispersion of organic fibers and the evaluation of such dispersion are thus both important techniques for developing ECC.
5 Conclusions
By using a fluorescence microscope and image processing, PVA fiber distribution in ECC can be evaluated quantitatively. The analysis shows that variations in ultimate tensile strain can be ascribed to the inhomogeneous distribution of the fibers, and that the distribution coefficient shows a linear correlation with the ultimate tensile strain.
6 References
- Chalfie, M., Tu, Y., Euskirchen G., Ward, W. W. and Prasher, D. C. (1994). “Green fluorescent protein as a marker for gene expression.” Science, 263, 802-805.
- Kobayashi, K. (1981). “Fiber reinforced concrete.” Tokyo: Ohm-sha.
- Lim, Y. M. and Li, V. C. (1997). “Durable repair of aged infrastructures using trapping mechanism of engineered cementitious composites.” J. Cement and Concrete Composites, 19 (4), 373-385.